
TLDR
XRP has gained nearly 5% in 24 hours, trading at $2.21 with strong support
Bollinger Bands indicator suggests potential 490% price increase based on historical patterns
Analysts project possible rise to $10.82, surpassing previous $3.40 all-time high
Technical analysis indicates key resistance levels at $2.42 and $2.92
Price movement coincides with potential regulatory changes under new administration
The cryptocurrency XRP has demonstrated notable price stability and upward movement in recent market conditions, maintaining its position above $2.20 despite broader market corrections affecting other major cryptocurrencies.
Trading data shows XRP has recorded a nearly 5% increase over the past 24 hours, while market leaders Bitcoin and Ethereum experienced declines of 2.2% and 4.6% respectively. This divergence from the general market trend has caught the attention of technical analysts and traders.
The current price action comes as XRP maintains strong support levels just below its trading price of $2.21. Market data indicates steady buying pressure at these levels, suggesting a solid foundation for potential future price movements.
Technical analysis of XRP’s price charts reveals interesting patterns, particularly in the Bollinger Bands indicator on the 12-hour timeframe. This volatility measurement tool shows a notable tightening pattern, similar to formations observed before previous price increases.
Analyst Steph, known for cryptocurrency technical analysis, has drawn attention to historical similarities in XRP’s Bollinger Band patterns. According to their research, the last time such a pattern emerged, XRP’s price experienced a 490% increase. If this pattern were to repeat, it could push XRP’s price toward $10.82.
The trading volume for XRP has remained steady during this period, with consistent activity across major exchanges. This stability in trading volume adds weight to the current price levels and suggests genuine market interest rather than temporary speculation.
Looking at key price levels, the $2.42 mark has emerged as an important resistance point. Technical analyst DarkDefender identifies this as a crucial level that XRP needs to break through before testing higher targets. Beyond this, $2.92 represents another key resistance level that could influence future price movement.
Historical data shows XRP’s previous all-time high stands at $3.40, reached in January 2018. The current market structure suggests potential for testing these levels, according to multiple technical analyses. Trading patterns indicate increasing buyer interest at current prices.
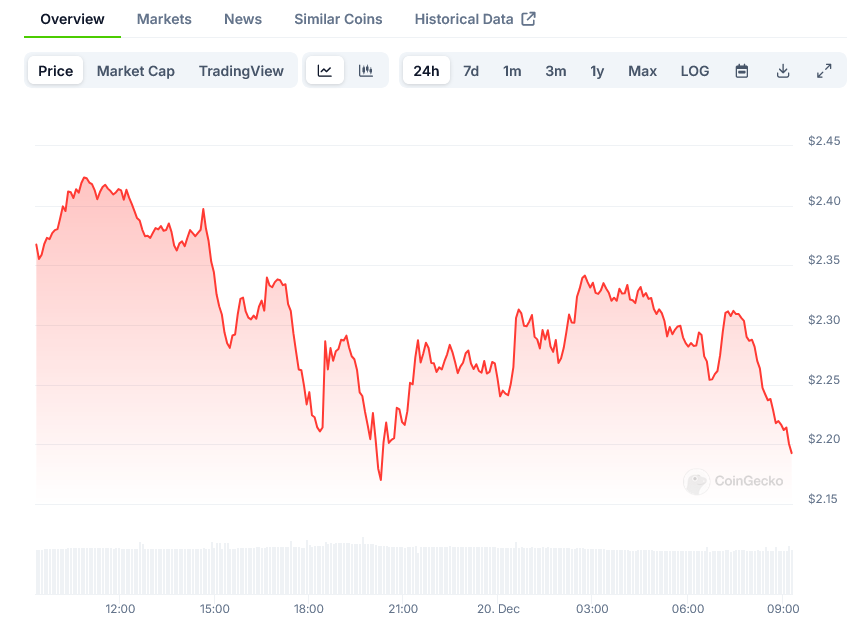
XRP Price on CoinGecko
Market participants have noted XRP’s ability to maintain price stability during broader market corrections. This relative strength has contributed to growing interest from traders looking for assets that can withstand market volatility.
The daily price chart shows multiple tests of support levels, with buyers stepping in consistently around the $2.20 mark. This price action has created a series of higher lows on the chart, typically considered a bullish pattern in technical analysis.
Another analyst, Javon, has examined XRP‘s previous bull market cycles. Their analysis suggests that if XRP follows similar patterns to its last full bull cycle, which saw a 600% increase, current prices could multiply several times over.
Trading data shows increased activity around key price levels, particularly near the $2.42 resistance point. This concentration of trading activity often indicates important technical levels that traders watch closely.
The current market structure shows XRP trading above several moving averages, typically considered a positive technical indicator. These moving averages have provided support during recent price pullbacks.
Price action on lower timeframes indicates steady accumulation, with buyers absorbing selling pressure at current levels. This behavior often precedes larger price movements, according to technical analysis principles.
Recent trading sessions have shown increased market participation during Asian trading hours, suggesting growing interest from markets in that region. This geographic diversification of trading activity can contribute to price stability.
The latest data shows XRP maintaining its position above $2.20, with steady trading volume and consistent buyer interest at current levels. Technical indicators continue to suggest potential for upward price movement, while support levels remain firm.
The post XRP Price Analysis: Support Builds as Trading Activity Increases appeared first on Blockonomi.