
TLDR
SUI recently hit a new all-time high but failed to maintain above $4.05
Currently trading at $3.83, showing strong potential for another breakout
Analyst Carl Runefelt predicts a target of $4.20 in the near term
The token is trading within a bullish flag formation
Bitcoin’s recent performance above $100K could support SUI’s upward momentum
The cryptocurrency market is witnessing renewed interest in the SUI token as it approaches its previous all-time high of $4.05, set on November 17. Currently trading at $3.83, the digital asset has shown resilience after a brief pullback from recent highs.
Market data indicates that SUI’s price movement has formed a bullish flag pattern, typically considered a continuation pattern in technical analysis. This formation has caught the attention of traders and analysts who monitor the token’s performance.
Trading volumes have remained steady during this approach toward previous highs, suggesting sustained market interest in the asset. The current price level represents a key test for the token as it attempts to build momentum for another potential upward move.
Prominent cryptocurrency analyst Carl Runefelt has shared his technical analysis of SUI’s current market position. According to Runefelt’s assessment, the token recently broke out of a 4-hour symmetrical triangle pattern, which he interprets as a bullish indicator.
The analyst has identified $4.20 as a potential near-term target for the token, suggesting this level could be reached within days or potentially hours, depending on market conditions. This target represents a premium over the previous all-time high.
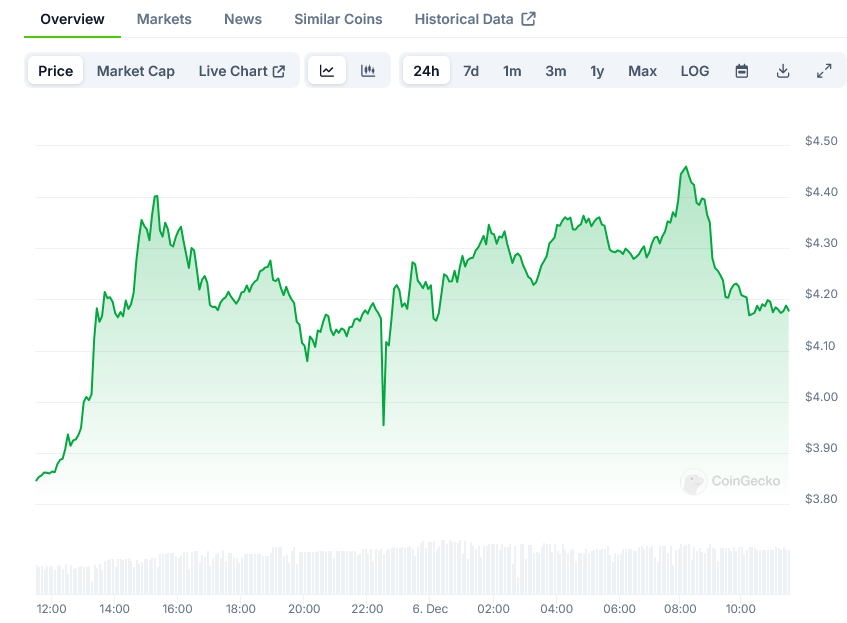
Sui Price on CoinGecko
Market observers note that SUI’s price action comes during a period of broader cryptocurrency market strength. Bitcoin’s performance above the $100,000 level has historically corresponded with increased activity in alternative cryptocurrencies.
The token’s current trading range shows a spread of about 6% from recent peak levels, demonstrating the market’s attempts to establish stable support before potentially moving higher. This consolidation phase has allowed for the development of clear technical levels that traders are watching.
Recent price data shows that SUI needs to clear the $3.88 level before challenging its previous high of $3.94. These represent key technical resistance points that could influence the token’s next directional move.
Trading patterns indicate increased market participation near these resistance levels, as buyers and sellers establish positions around these key price points. The volume profile suggests active interest from both retail and larger market participants.
Technical indicators show the formation of support levels below current prices, providing potential cushioning against downside moves. These support zones have been tested multiple times during recent trading sessions.
Market makers have established liquidity pools around key price levels, which could help facilitate smoother price action as the token tests higher levels. This market structure suggests preparation for increased trading activity.
The four-hour chart reveals the development of higher lows, indicating steady buying pressure despite occasional pullbacks. This pattern aligns with the broader bullish flag formation noted by analysts.
Short-term price action shows consolidation near the upper end of recent trading ranges, as market participants position themselves for potential breakout scenarios. Trading volume patterns support this consolidation phase.
Recent market data indicates that a break above $3.88 could trigger increased buying activity, as this level represents a near-term technical barrier. Success at this level could pave the way for a test of previous highs.
Current market prices place SUI approximately 5% below its all-time high, with technical indicators suggesting continued interest from market participants at these levels. Trading volumes remain consistent with recent averages, indicating sustained market engagement.
The post SUI Token (SUI) Price: Action Indicates Possible Break of Previous High appeared first on Blockonomi.