
TLDR
Sui (SUI) maintains a bullish trend with strong support at $3.2, showing potential for new all-time highs
Recent price consolidation between $3.1 and $3.94 suggests a period of accumulation
Open Interest dropped by $45 million in the last 20 hours, indicating profit-taking by bullish traders
Liquidation data shows significant liquidity clusters at $4.00 and $3.17 levels
Technical indicators remain mostly bullish despite short-term volatility
The cryptocurrency Sui (SUI) continues to display strong market performance as it consolidates below recent highs, with technical data suggesting potential moves toward the $4.00 price level. The digital asset has maintained an upward trajectory since early August, experiencing only shallow pullbacks during its ascent.
Recent market data shows SUI trading within a defined range between $3.1 and $3.94, with the critical mid-point level at $3.52 serving as a key reference point for traders. This consolidation phase comes after several months of steady gains, suggesting a period of price discovery and accumulation.
Technical analysis of the daily timeframe reveals a series of higher lows, with the most recent support levels established at $2.82 and $2.97. These price points have become crucial markers for maintaining the current bullish market structure, with traders closely monitoring these levels for potential breakdown signals.
The Relative Strength Index (RSI) maintains a position at 60, staying above the neutral 50 mark for four consecutive weeks. This technical indicator supports the overall bullish narrative, although recent price action has shown signs of consolidation rather than immediate upward momentum.
On-chain metrics provide additional context to the current market situation. The On-Balance Volume (OBV) indicator shows a consistent uptrend, indicating sustained buying pressure in the market. However, the Money Flow Index (MFI) has experienced a decline over the past ten days, suggesting a temporary pause in buying momentum.
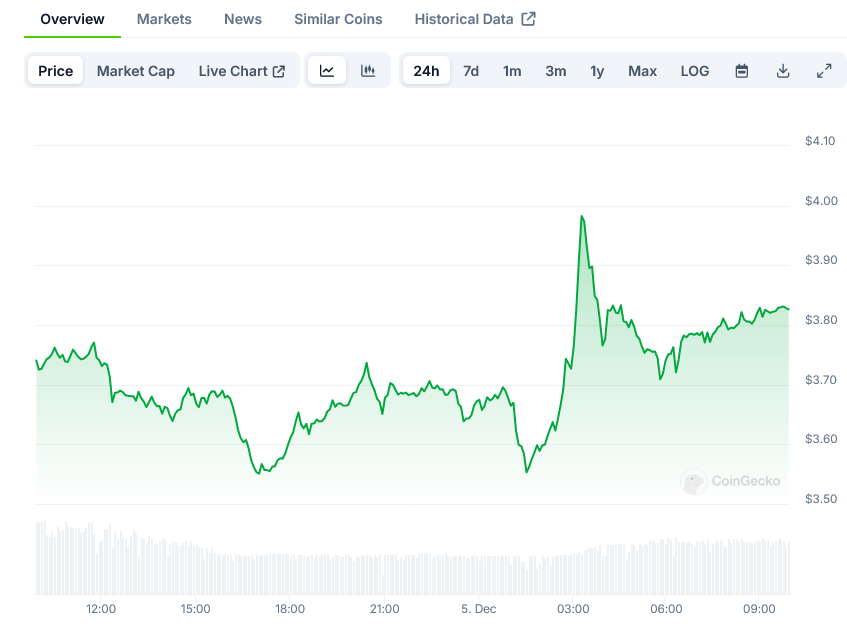
Sui Price on CoinGecko
Recent market activity saw a sharp price increase on December 3rd, accompanied by a rise in Open Interest. However, the subsequent 20-hour period witnessed a $45 million decrease in Open Interest, indicating that some bullish traders have chosen to secure profits rather than maintain their positions.
The spot Cumulative Volume Delta (CVD) has shown resistance to establishing an upward trend, which aligns with the MFI’s indication of reduced buying pressure. This technical signal suggests that a breakout from the current range may require additional time and market participation.
Liquidation data reveals important price levels that could influence future price action. A substantial cluster of liquidation orders exists at the $4.00 price point, with another notable concentration at $3.17, positioning these levels as potential targets for price movement in both directions.
Market analysts note that range-bound trading patterns often conclude with a temporary move below key support levels before establishing higher prices. This characteristic suggests that traders should be prepared for possible price movements toward both $3.5 and $3.2 in the near term.
The daily chart’s market structure remains bullish despite short-term price variations. However, traders should note that a daily close below $2.97 would constitute a break in market structure and could signal a shift toward bearish sentiment.
Trading volume patterns indicate steady participation, though recent consolidation has been marked by lower volatility compared to previous upward moves. This reduction in volatility often precedes larger price movements, according to historical market behavior.
Price action in the immediate term shows resistance at previous local highs, with buyers attempting to establish support at the range’s mid-point. The $3.52 level has transformed from resistance to support, suggesting strengthening bullish control over short-term price action.
Technical support levels have held firmly during recent retests, demonstrating buyer presence at key price points. This behavior reinforces the broader bullish narrative while highlighting the importance of established support zones.
The most recent price data shows SUI maintaining positions above key moving averages, further supporting the bullish market structure. Trading volume during pullbacks has remained relatively low, suggesting limited selling pressure at current levels.
Current market data indicates SUI’s price at $3.65, with 24-hour trading volume reaching $156 million across major exchanges.
The post Sui (SUI) Price Update: Market Structure Remains Bullish Despite Short-term Volatility appeared first on Blockonomi.