
TLDR
SUI cryptocurrency showing bullish momentum after rebounding from $1.5 support
Price currently trading above 100-day Simple Moving Average
Key resistance level identified at $2.18, with potential target at all-time high of $2.36
Technical indicators, including Composite Trend Oscillator, suggest positive trend
Critical support levels established at $1.5 and $1.42
SUI cryptocurrency has shown renewed strength in recent trading sessions, mounting a recovery after finding solid support at the $1.5 price level.
The digital asset is currently testing the $2.18 resistance level, supported by multiple technical indicators suggesting continued upward momentum.
Recent price action shows SUI trading above its 100-day Simple Moving Average (SMA), a technical indicator often used to determine trend direction.
This positioning above the SMA has provided traders with a clear signal of the current market structure.
The 4-hour chart reveals a steady build-up of buying pressure since the rebound from the $1.5 support level. Trading volumes have remained consistent during this upward move, indicating sustained interest from market participants.
Technical analysis of the price action shows the formation of bullish candlestick patterns on the daily timeframe. These patterns have emerged following the successful defense of the $1.5 support zone, suggesting buyers have regained control of the market momentum.
The Composite Trend Oscillator, a key technical indicator, displays bullish signals on multiple timeframes. On the 4-hour chart, both the SMA and signal lines have crossed above the zero line, traditionally interpreted as a positive sign for price momentum.
Adding to the technical picture, the spread between the oscillator’s signal lines has widened, potentially indicating strengthening buying pressure.
This technical development aligns with the overall price structure seen in recent trading sessions.
Support levels have been established at $1.5 and $1.42, providing potential cushions should the price experience a pullback. These levels have previously demonstrated their importance as areas of buyer interest.
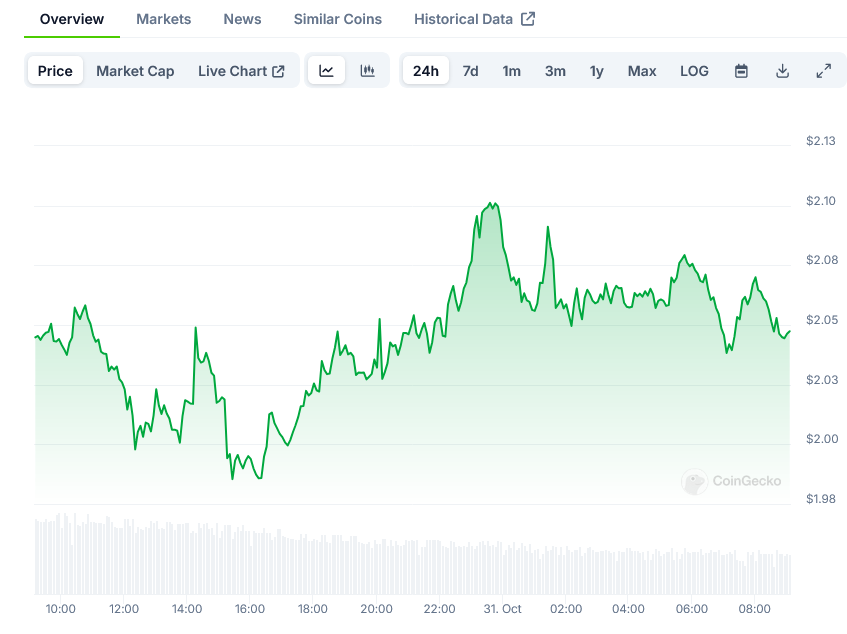
Sui Price on CoinGecko
The current resistance level at $2.18 represents the immediate challenge for buyers. A successful breach of this level could open the path toward the asset’s all-time high of $2.36, though traders remain cautious of potential selling pressure at these levels.
Daily chart analysis reveals the price maintaining position above key moving averages, suggesting the underlying trend remains positive.
Trading volumes have shown consistency during the recent price advance, indicating sustained market participation.
The 1-day chart’s Composite Trend Oscillator formation shows fresh bullish movement, with the signal line approaching a potential crossover of the SMA line.
This technical development may provide additional confirmation of the current trend direction.
Market data indicates increased trading activity as the price approaches the $2.18 resistance level. This heightened activity suggests traders are actively monitoring these price levels for potential breakout opportunities.
Should the price fail to breach the $2.18 resistance, technical analysis suggests the $1.5 support level would be the first area to watch for potential buyer interest. This level has previously demonstrated its importance in the price structure.
Price action on lower timeframes shows consolidation patterns forming near the resistance level, indicating traders may be positioning themselves for the next directional move.
Trading volumes have remained steady during the recent price advance, suggesting market participants maintain interest in the asset at current levels. This volume profile adds weight to the technical structure observed in price charts.
The most recent price data shows SUI trading at $2.03 on the daily chart, as buyers continue their attempts to push the price toward the $2.18 resistance level.
The post SUI Price Tests $2.18 Resistance After $1.5 Support Rebound appeared first on Blockonomi.