
TLDR
SOL price currently hovering between $180-$200, down from $220 at start of 2025
Technical analysis shows formation of symmetrical triangle pattern with key levels at $214 and $183
Trading volume up 26% to $4.86B despite market pullback
Price decline occurred despite recent SOL ETF approval
RSI at 32 on 4-hour chart, approaching oversold territory
Solana’s price action has captured market attention as it tests crucial support levels while showing impressive trading volume. The cryptocurrency currently trades at $182, marking a notable decline from its early 2025 levels above $220.
The price movement comes during a broader market pullback, with Bitcoin struggling below $95,000. Despite this challenging environment, Solana’s trading metrics reveal interesting developments that suggest an important price movement may be approaching.
Recent data from Coinglass shows a remarkable 26% surge in Solana’s derivatives trading volume, reaching $4.86 billion. This increase in trading activity occurs even as open interest in derivatives contracts decreased slightly by 1.67%, settling at $6.10 billion.
The technical picture shows Solana forming a symmetrical triangle pattern on the charts, according to crypto analyst Ali. This formation typically precedes a decisive price move, with key levels established at $214 and $183. A break above or below these levels could trigger a price movement of approximately 40%.
The 4-hour chart’s Relative Strength Index (RSI) currently reads 32, approaching oversold territory. This technical indicator suggests the recent selling pressure has been substantial, with the price experiencing a 15% decline over the past week.
Short-term price action shows Solana maintaining support above the $180 level, which has proven to be a strong foundation during the current market correction. If this support holds, traders are watching the $200 level as the first major resistance, followed by the potential target of $214.
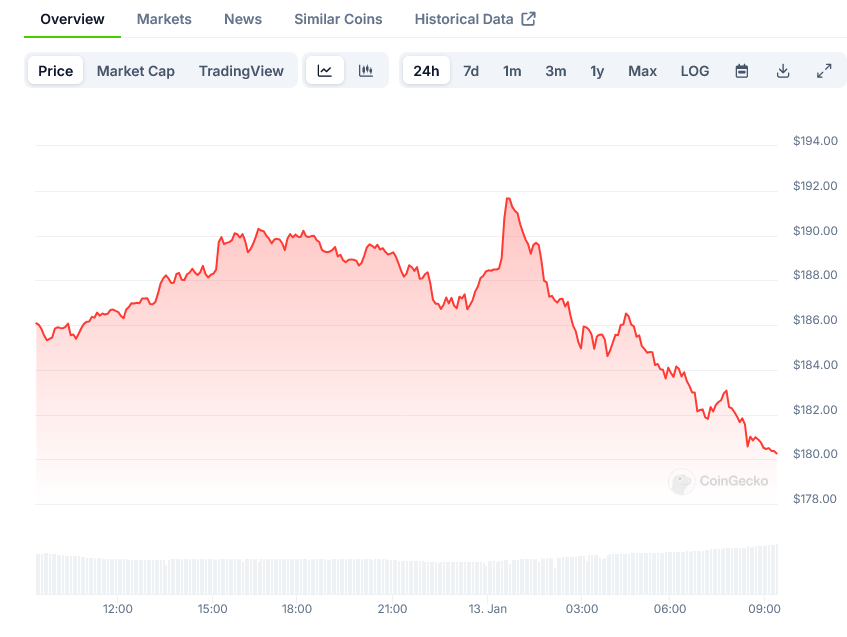
Solana Price on CoinGecko
However, market participants remain cautious of potential downside risks. A break below the $180 support could push prices toward the next support level at $170, representing a deeper correction from current levels.
The recent SOL ETF approval, while generating initial excitement, hasn’t prevented the ongoing market correction. This development continues to influence market sentiment, though price action suggests technical factors are currently driving short-term movements.
Trading activity remains robust despite the price decline. The increased volume indicates active participation from both buyers and sellers, suggesting strong market interest at current levels.
The daily trading data shows a 2% decrease in the past 24 hours, contributing to the larger weekly decline. This steady deterioration in price has brought SOL to its current pivotal level.
#Solana $SOL is consolidating within a symmetrical triangle! A breakout above $214 or below $183 could spark a 40% move. pic.twitter.com/brilMiu3M9
— Ali (@ali_charts) January 12, 2025
Market makers and traders are closely monitoring the triangle pattern formation. Historical data suggests such patterns often lead to substantial price movements once resolved.
The derivatives market activity provides additional insight into trader sentiment. While the surge in trading volume indicates high interest, the slight decline in open interest suggests some positions are being closed rather than opened.
Price support at $180 has been tested multiple times during this correction, with buyers stepping in to defend this level. The market’s ability to maintain this support will be crucial for short-term price direction.
The current price range between $180 and $200 represents a consolidation zone, with neither buyers nor sellers gaining clear control. This equilibrium typically breaks with a surge in volume and price momentum in either direction.
The most recent trading sessions show increasing sensitivity to broader market movements, with SOL price action closely correlating with general crypto market trends.
The post Solana (SOL) Price: Solana Trading Volume Tops $4.86B in Triangle Pattern appeared first on Blockonomi.