
TLDR
Shiba Inu (SHIB) price showing potential bull flag pattern
Technical analysis suggests possibility of 400% breakout
RSI broken above descending trendline, now trending upward
Current price around $0.00001809, up 11.84% from recent low
Some analysts predicting return to all-time high of $0.000081
Recent technical analysis of Shiba Inu’s (SHIB) price action has revealed a potential bull flag pattern, sparking interest among crypto traders and analysts.
This development comes as the popular meme-inspired cryptocurrency experiences heightened volatility in the market.
According to an analyst on the TradingView platform, SHIB’s price chart since the beginning of the year shows a significant correction, with the token retracing approximately 75% from its yearly high of $0.00003595.
This correction has been characterized by a series of lower highs and lower lows, forming what technical analysts refer to as a bull flag pattern.
The bull flag pattern is often interpreted as a signal for the continuation of an upward trend following a period of consolidation.
In this case, some analysts believe that a breakout above the bull flag could lead to a substantial price increase for SHIB.
Adding to the bullish sentiment, the Relative Strength Index (RSI) for SHIB has recently broken above a descending trendline for the first time since April.
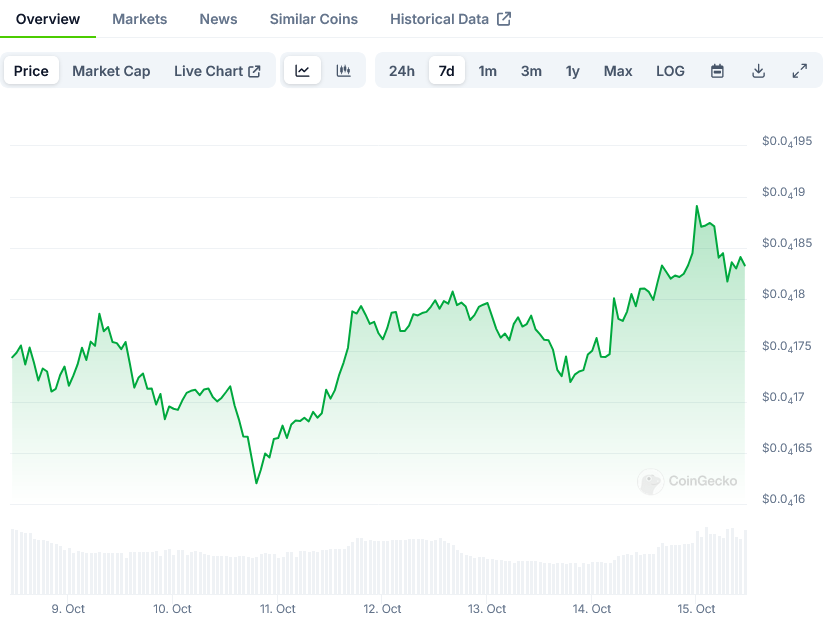
Shiba Inu Price on CoinGecko
The RSI, which currently stands at 54.7 on the 5-day chart, is now trending upward, potentially indicating increased buying pressure from investors.
While the possibility of SHIB retesting the bull flag pattern remains, some analysts are drawing parallels to the token’s last major breakout. During that previous rally, SHIB experienced a surge of approximately 400%, reaching a peak of $0.00003595.
If a similar scenario were to unfold, projections suggest that Shiba Inu could potentially reach a target between $0.00006204 and $0.000074.
The past week has seen intense volatility in SHIB’s price action. From October 7 to October 10, the token’s price trended downward, reaching a low of $0.00001613.
Since then, SHIB has gained about 11.84%, although it has faced resistance multiple times at the $0.00001809 level.
As of the latest data, SHIB is trading at $0.00001809. Another analyst, Javon Marks, has echoed the possibility of SHIB returning to its all-time high.
Based on an earlier breakout of a falling wedge pattern, Marks’ analysis suggests that SHIB could potentially reach $0.000081.
The post Shiba Inu Price Forms Potential Bull Flag Pattern, Analysts Report appeared first on Blockonomi.