
TLDR
MATIC price shows upward momentum from $0.580 support level
Currently trading above $0.650 and 100-hour moving average
Broke above bearish trend line at $0.6350
Key resistance levels at $0.680 and $0.700
Technical indicators suggest bullish momentum building
Polygon’s native token MATIC has established a strong support base above $0.580, marking the beginning of a fresh price increase. The digital asset has shown steady growth, breaking above several key technical levels as it approaches the $0.70 mark.
The price movement began with a decisive break above the $0.620 level, following similar upward trends seen in major cryptocurrencies like Bitcoin and Ethereum. This movement has placed MATIC in a favorable position above both the $0.650 price point and the 100-hour simple moving average.
Technical analysis reveals the breach of a bearish trend line that had previously acted as resistance at $0.6350 on the hourly chart. This breakthrough suggests a shift in market sentiment and potentially marks the end of a previous downward trend.
The current price action shows MATIC testing the $0.680 resistance zone, with the token maintaining its position well above the 23.6% Fibonacci retracement level. This retracement is measured from the recent swing low of $0.5715 to the local high of $0.6800.
Trading data indicates increased buying pressure as the token maintains its position above the crucial $0.650 support level. The immediate resistance lies near the $0.680 zone, with the first major hurdle positioned at the psychologically important $0.70 level.
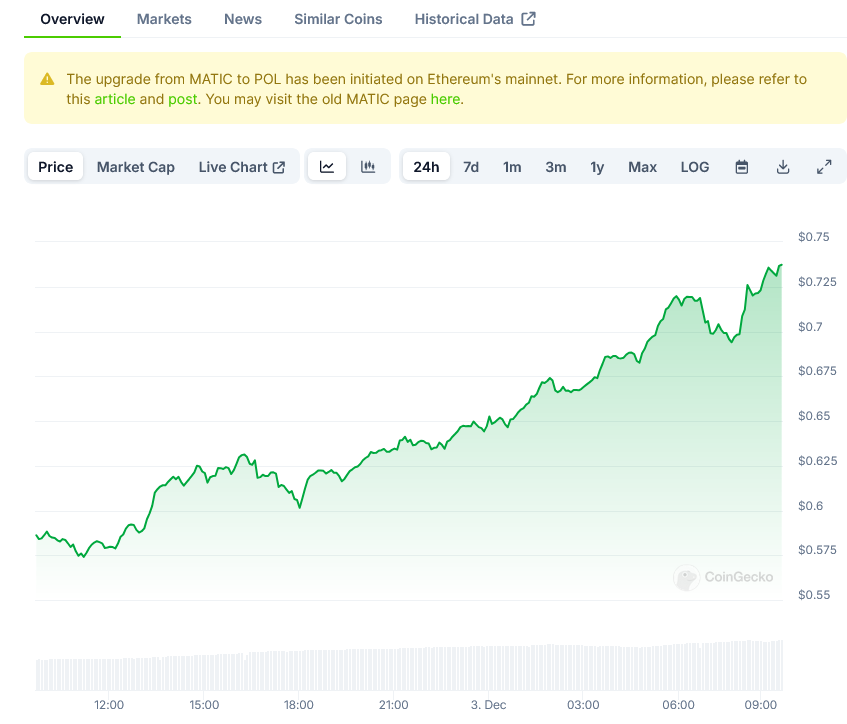
POL Price on CoinGecko
Market technicals suggest that a break above $0.70 could trigger additional buying interest. In such a scenario, the next major resistance level would be found near $0.750, with potential for extension toward the $0.780 or $0.80 price points.
However, the market structure also presents possible downside scenarios. If MATIC fails to overcome the $0.680 resistance, a retracement could occur. The immediate support level is positioned at $0.650, with a more substantial support zone near $0.6250.
This $0.6250 level coincides with the 50% Fibonacci retracement of the recent upward movement. A break below this point could potentially lead to a test of the $0.60 support level, with the next major support waiting at $0.5750.
Technical indicators currently favor the bullish case. The MACD (Moving Average Convergence Divergence) indicator shows increasing momentum in the bullish zone, suggesting growing buying pressure in the market.
The Relative Strength Index (RSI) remains above the 50 level, indicating healthy buying pressure without reaching overbought conditions. This suggests room for potential upward movement before any technical exhaustion occurs.
Volume analysis shows increased trading activity during the recent price advance, providing validation to the upward movement. This volume expansion during price increases is generally considered a positive technical signal.
The price structure has formed a series of higher lows, a pattern typically associated with upward trends in technical analysis. This pattern suggests buyers are becoming more aggressive at progressively higher price levels.
Support levels have been established at $0.6500 and $0.6250, providing potential bouncing points should any short-term selling pressure emerge. These levels align with previous areas of price congestion and technical indicators.
The resistance levels at $0.6800 and $0.7000 represent the immediate hurdles for further price advancement. These levels have shown historical importance as areas where selling pressure has previously emerged.
The most recent data shows MATIC maintaining its position above the 100-hour moving average, with steady trading volume supporting the price action near the $0.680 resistance zone.
The post Polygon (MATIC) Price Analysis: Bulls Eye $0.70 Resistance Level appeared first on Blockonomi.