
TLDR
Exchange data shows $15 million worth of PEPE moved off exchanges in the past two trading days, suggesting increased holder accumulation
Over 80% of top Binance traders are currently in long positions on PEPE, indicating strong bullish sentiment
Technical analysis reveals a descending triangle pattern with potential 17% upside if price breaks above $0.0000243
Current RSI levels suggest room for further upward movement before reaching overbought conditions
Trading volume has increased 15% in 24 hours alongside a 1.5% price rise, showing growing market interest
The memecoin PEPE has seen substantial movement off cryptocurrency exchanges over the past 48 hours, with on-chain data showing outflows of $15 million. This development comes as technical indicators point to a possible 17% price increase in the coming days.
According to data from analytics firm Coinglass, the substantial exchange outflows suggest larger holders may be moving their PEPE tokens into longer-term storage wallets rather than keeping them ready for trading. Historically in cryptocurrency markets, such behavior often precedes upward price movement.
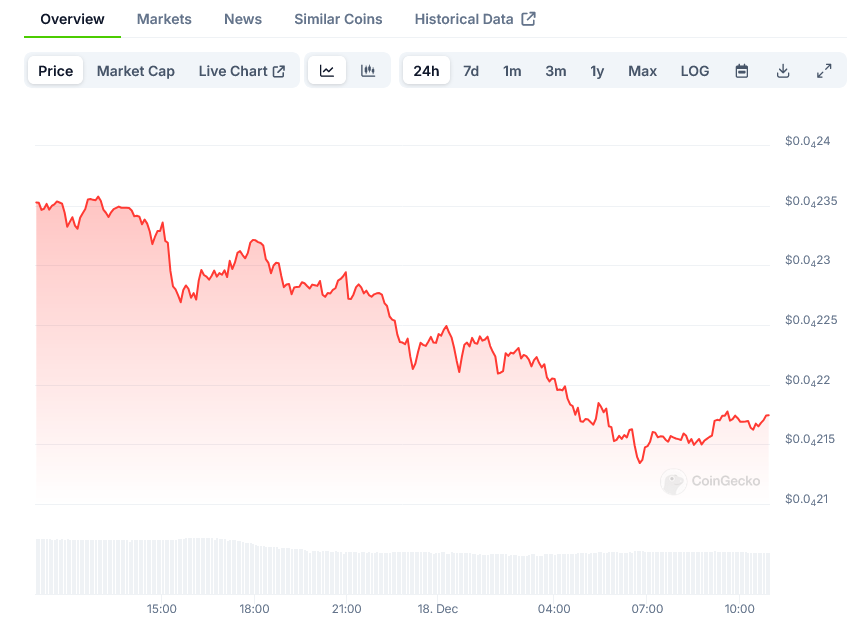
The current trading price of PEPE sits at $0.0000235, having risen 1.5% in the last 24 hours. More notably, trading volume has jumped 15% during this same period, indicating heightened market activity around the token.
On major cryptocurrency exchange Binance, trader positioning shows a strong bias toward further upside. The platform’s long-to-short ratio for PEPE currently stands at 4.15, with 80.57% of top traders holding long positions compared to just 19.43% maintaining short positions.
Technical analysis of PEPE’s price chart reveals the formation of a descending triangle pattern on the four-hour timeframe. This pattern typically resolves in a breakout movement, with traders watching the $0.0000243 level as a key threshold. A sustained move above this price point could trigger a rally toward $0.000028, representing a 17% gain from current levels.
The token’s Relative Strength Index (RSI), a common momentum indicator, remains below overbought territory. This technical factor suggests PEPE has room for additional upward movement before reaching levels that typically prompt traders to take profits.
Pepe Price on CoinGecko
PEPE currently ranks as the third-largest memecoin by market capitalization, following behind the more established Dogecoin and Shiba Inu. The token has managed to maintain trader interest despite broader market uncertainty affecting many cryptocurrencies.
Recent price action shows PEPE diverging from some other digital assets that have struggled to find direction. While market leaders Bitcoin, Ethereum, and XRP have shown upward momentum, many smaller cryptocurrencies have faced challenges maintaining price stability.
The $15 million in exchange outflows represents a notable shift in token movement patterns. When cryptocurrency holders move assets off exchanges into private wallets, it often indicates an intention to hold for longer periods rather than actively trade.
Trading data from Binance provides additional context for market sentiment. The 4.15 long-to-short ratio suggests traders on the platform overwhelmingly expect higher prices, though such extreme positioning can sometimes act as a contrary indicator.
Looking at specific price levels, the $0.0000243 mark serves as immediate resistance. This level aligns with the upper boundary of the observed descending triangle pattern on four-hour charts. A break above this threshold could accelerate buying pressure.
The targeted move to $0.000028 would represent the measured objective of the triangle pattern breakout. This technical projection is derived from the height of the pattern added to the breakout point.
Volume analysis shows increasing market participation, with 24-hour trading volume rising 15% alongside the recent price increase. Higher volume during price rises typically validates the strength of a move.
The latest data from Coinglass’s Spot Inflow/Outflow metrics tracks the movement of PEPE tokens between exchanges and external wallets over the past two trading days. The $15 million outflow figure represents the net difference between tokens entering and leaving exchange wallets.
The 1.5% price increase over the past 24 hours has occurred on progressively higher volume, suggesting growing trader interest in PEPE’s market movements. The price currently trades at $0.0000235, with immediate resistance at $0.0000243.
The post $PEPE Price Analysis: Triangle Pattern Targets $0.000028 Amid Exchange Outflows appeared first on Blockonomi.