
TLDR
Ethereum has experienced a sharp decline, dropping below $3,680 and currently trading under $3,550
A key bearish trend line has formed with resistance at $3,650 on the hourly chart
The cryptocurrency reached a low of $3,324, with current major support at $3,320
Technical indicators, including MACD and RSI, suggest continued bearish momentum
Recovery would require breaking through multiple resistance levels, with $3,715 being a crucial point
Ethereum’s price trajectory has taken a downward turn, with the leading altcoin dropping below several key support levels in recent hours. The cryptocurrency has fallen more than 7% and is currently trading below the $3,550 mark, showing continued bearish pressure in the short term.
The decline began as Ethereum struggled to maintain momentum above the $3,680 level, leading to a cascade of technical support breaks. The price action mirrors the broader market movement, with Bitcoin also experiencing similar downward pressure during the same period.
Trading data from Kraken shows that Ethereum’s price movement has broken below the 100-hourly Simple Moving Average, a technical indicator often used to determine market trends. This break suggests that bears have gained control of the immediate price action.
The depth of the current decline became apparent as Ethereum’s price continued to slide, eventually reaching a local low of $3,324. This price point represents a notable departure from recent trading ranges and has established a new support level that traders are watching closely.
Technical analysis of the hourly chart reveals the formation of a bearish trend line with resistance positioned at $3,650. This pattern suggests that any attempted recovery will face strong selling pressure at these higher levels.
Current market data indicates that Ethereum is consolidating around the $3,510 level, which coincides with the 23.6% Fibonacci retracement level. This technical measure takes into account the recent price swing from $4,105 to the low of $3,324.
For traders looking at potential recovery scenarios, the first major hurdle appears at the $3,650 mark. This level is reinforced by the previously mentioned bearish trend line, making it a crucial point for any potential upward movement.
A more substantial resistance level has formed near $3,715, which represents the 50% Fibonacci retracement level of the recent downward movement. This price point could prove to be a key battleground between bulls and bears in the coming trading sessions.
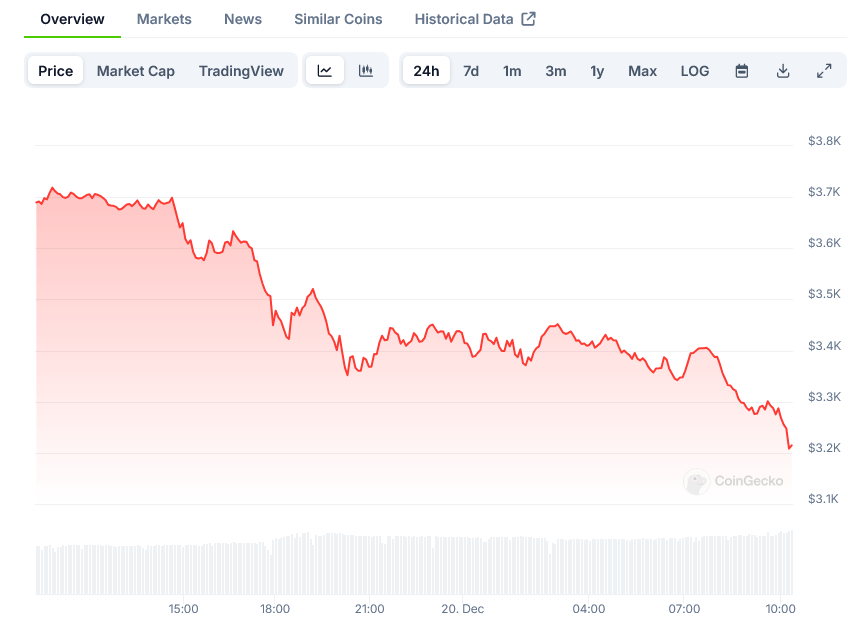
Ethereum Price on CoinGecko
Should buyers manage to push the price above these immediate resistance levels, the next major target would be the $3,800 mark. A successful break above this point could open the path toward the psychologically important $4,000 level.
However, the current technical setup suggests that downside risks remain prevalent. The immediate support level to watch is near $3,350, with a more substantial support zone established around $3,320.
If selling pressure continues and Ethereum fails to hold these support levels, the next potential landing zones appear at $3,250 and $3,150. Technical traders are particularly watching the $3,050 level as a crucial support point that could come into play if the current bearish momentum persists.
The hourly MACD (Moving Average Convergence Divergence) indicator is showing increasing momentum in the bearish zone, adding weight to the negative short-term outlook. This technical indicator is often used to measure trend strength and direction.
Similarly, the RSI (Relative Strength Index) for ETH/USD has dropped below the 50 zone, suggesting that bearish pressure currently dominates the market sentiment. The RSI is a momentum indicator that helps traders identify overbought or oversold conditions.
Trading volume data indicates increased selling activity during this price decline, with multiple large transactions recorded as the price broke through various support levels.
The price action has created a series of lower highs and lower lows on the hourly chart, a pattern that typically indicates a continuing downward trend in technical analysis.
Market data shows that order books are currently weighted toward the sell side, with substantial resistance building up near the $3,650 level.
Recent price action has led to the liquidation of multiple long positions, contributing to the downward pressure as forced selling triggers additional price declines.
Hourly chart patterns suggest the formation of a bearish flag, indicating that the current consolidation might be temporary before another potential move lower.
The post Ethereum (ETH) Price Update: Price Action Suggests Bearish Momentum Below $3,650 appeared first on Blockonomi.