
TLDR
Ethereum failed to break through $3,450 resistance and continued declining, now trading below $3,400
A bearish trend line has formed with resistance at $3,340 on the hourly chart
First major resistance is at $3,475, with main resistance at $3,500
Key support levels are at $3,220, $3,150, and $3,000
Technical indicators show momentum in the bearish zone with RSI below 50
Ethereum’s price movement has captured market attention as the second-largest cryptocurrency by market capitalization tests key support levels. The digital asset recently experienced downward pressure, falling below the $3,400 mark after failing to breach resistance at $3,450.
Trading data shows that Ethereum’s price action has established a new support zone around $3,200, with buyers stepping in to defend this level. The cryptocurrency formed a local bottom at $3,213, suggesting potential buyer interest at these prices.
Market participants have observed increased trading volume as Ethereum tests these crucial price points. The hourly chart reveals a bearish trend line forming with resistance at $3,340, indicating short-term selling pressure remains active.
Technical analysis of the ETH/USD pair shows the price trading below the 100-hourly Simple Moving Average, a commonly watched technical indicator. This positioning suggests bears maintain control of immediate price action.
The cryptocurrency faces several resistance levels on its path to recovery. The first major hurdle appears at $3,350, followed by a more substantial resistance zone near $3,475. This level represents the 50% Fibonacci retracement of the recent decline from $3,743 to $3,213.
Trading data indicates that a move above $3,500 could trigger renewed buying interest. Market analysts note that clearing this level might open the path toward $3,550 and potentially $3,650.
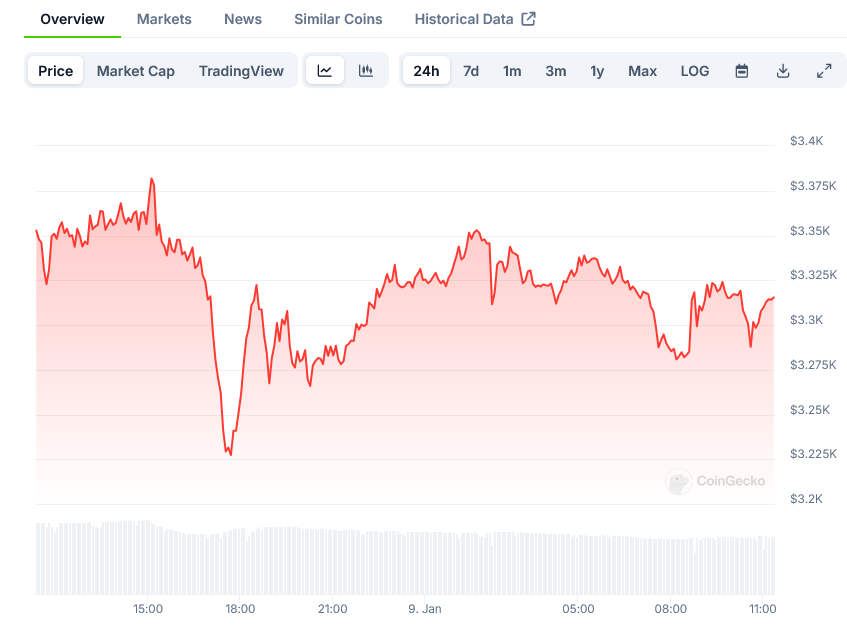
Ethereum Price on CoinGecko
The hourly Relative Strength Index (RSI) remains below the 50 mark, suggesting momentum favors sellers in the short term. However, oversold conditions could develop if the price continues to decline.
Support levels have emerged at various price points during the recent market action. The $3,280 zone represents immediate support, while $3,220 serves as a crucial level that buyers have defended.
Market observers note that a breach below $3,220 could lead to testing lower support zones. The next major support levels lie at $3,150 and $3,000, prices that previously showed strong buyer interest.
Volume analysis reveals increased trading activity during recent price movements. This surge in volume suggests active market participation as traders position themselves at these price levels.
The MACD indicator on the hourly timeframe shows momentum in the bearish zone, aligning with current price action. This technical signal adds weight to the short-term bearish narrative.
Price data shows that Ethereum has retraced from its recent high of $3,743, establishing a series of lower highs. This pattern has created resistance levels that bulls need to overcome for trend reversal.
Chart analysis reveals the formation of a consolidation pattern below the 23.6% Fibonacci retracement level. This technical setup suggests traders are watching for clear directional signals.
Historical price action indicates similar patterns have preceded both continued declines and sharp reversals. Current market conditions show balanced trading activity at these levels.
The most recent price data shows Ethereum trading at $3,320, with immediate resistance at $3,340 and support at $3,280.
The post Ethereum (ETH) Price: Key Support Level at $3,200 Draws Market Interest appeared first on Blockonomi.