
TLDR
BNB experienced a price correction, dropping below $580 from $600 resistance zone
A low point was established at $565 before bulls initiated recovery
Price broke above bearish trend line at $585
Currently trading below $590 and 100-hourly moving average
Key resistance levels identified at $590, $598, and $605
BNB’s price movement has shown notable volatility in recent trading sessions, with the cryptocurrency experiencing both downward pressure and recovery attempts.
After reaching the $600 resistance zone, BNB underwent a correction that pushed its price below several key support levels.
The downward movement began when BNB failed to maintain momentum above $605, triggering a series of declining price points.
The correction saw the price drop below the $590 mark, followed by further dips under $585 and $580 support levels.
During this corrective phase, the price continued its descent, breaking below $575 and eventually reaching $572. The selling pressure persisted until BNB touched a local low of $565, where buyers stepped in to provide support.
The market has since shown signs of recovery, with BNB climbing back above the $575 level. This upward movement coincided with a break above the 50% Fibonacci retracement level, calculated from the $598 swing high to the $565 low.
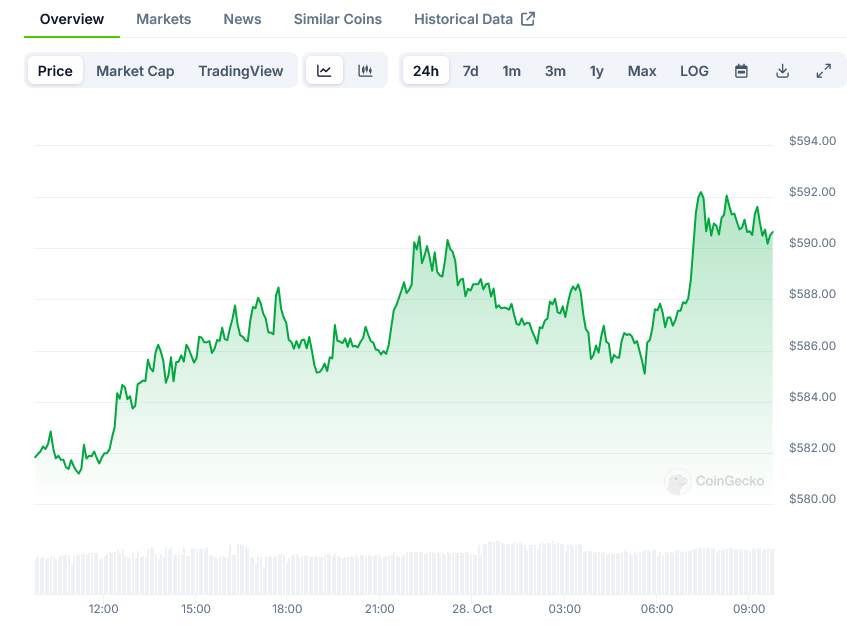
Technical analysis reveals a breakthrough above a bearish trend line, which had established resistance at $585 on the hourly chart.
BNB Price on CoinGecko
However, the price continues to trade below both the $590 level and the 100-hourly simple moving average, indicating ongoing overhead resistance.
The current market structure suggests several key resistance levels that traders are watching. The immediate resistance sits at $590, which aligns with the 76.4% Fibonacci retracement level of the recent downward movement.
Should BNB successfully break above $590, the next challenge lies at $598. A decisive move above this level could open the path toward $605, which serves as a crucial psychological and technical barrier.
The market shows potential for further upside movement if buyers can maintain momentum. A successful break and close above $605 could trigger an extended rally, potentially pushing the price toward $620 and possibly extending to $632.
However, the downside scenario remains equally possible. If BNB fails to overcome the $590 resistance, it might face renewed selling pressure. The first line of support in such a scenario would be at $585, followed by a stronger support level at $582.
The $572 level represents a critical support zone that bulls need to defend. A breach below this point could trigger increased selling pressure, potentially leading to a retest of the recent $565 low.
Technical indicators present a mixed picture. The hourly MACD shows decreasing bullish momentum, while the Relative Strength Index (RSI) hovers near the neutral 50 level, suggesting market indecision.
The hourly chart patterns indicate the formation of several support and resistance zones that could influence future price action. These technical levels are likely to play crucial roles in determining the next directional move.
Market participants are closely monitoring volume patterns and order book data for signs of potential trend continuation or reversal. The price action suggests active participation from both buyers and sellers at current levels.
The most recent data shows BNB trading below the 100-hourly moving average, with immediate resistance at $590 and support at $585. These levels continue to act as key reference points for short-term trading decisions.
The post BNB Price Corrects Below $580, Shows Signs of Recovery appeared first on Blockonomi.