
TLDR:
BNB recently bounced back from $635 support level and is trading above $675, showing strong recovery momentum
Technical analysis reveals a cup-and-handle pattern suggesting potential for significant upward movement to $1,147
Binance founder CZ emphasized BNB’s long-term value, noting no investor has lost money holding for over 4 years
Price faces immediate resistance at $685 and $692 levels, with major support at $668 and $655
Current trading patterns and technical indicators show bullish momentum despite recent market downturn
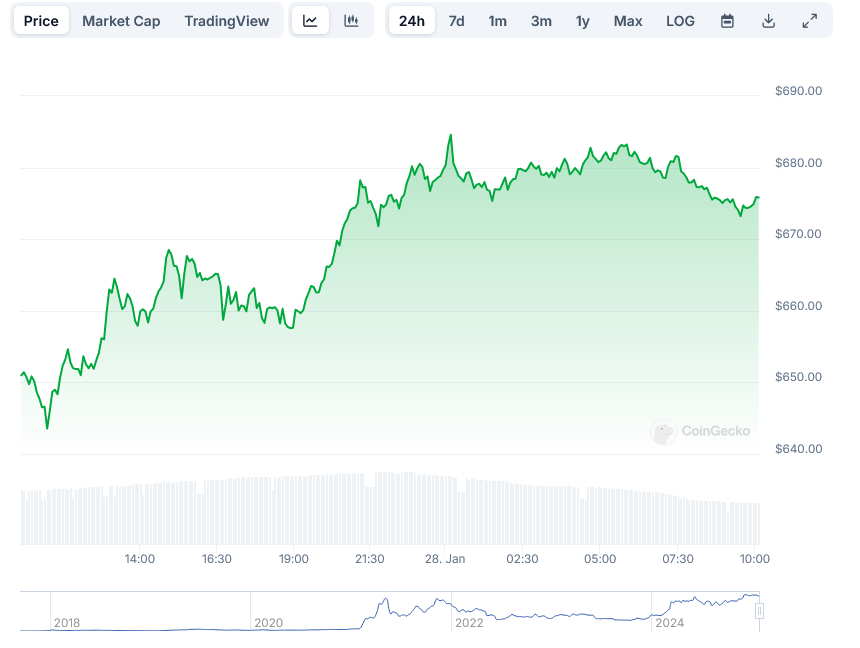
BNB, the native token of the Binance ecosystem, has shown strong recovery movements after finding support at the $635 level. The cryptocurrency is currently trading above $675, demonstrating resilience in the face of broader market fluctuations.
Recent price action shows BNB breaking above a bearish trend line at $674 on the hourly chart. The move came after the token experienced a pullback from its recent high of $691, mirroring similar movements in other major cryptocurrencies like Bitcoin and Ethereum.
The recovery phase has been marked by several technical developments. BNB has moved above both the $675 price point and the 100-hourly simple moving average. This positioning suggests growing strength in the current price movement, as these levels often serve as important technical indicators for traders.
BNB
BNB Price
In the immediate term, BNB faces resistance near the $685 level, with another crucial barrier at $692. Market observers note that a clear break above $692 could pave the way for testing the $700 mark, which represents a key psychological level for traders.
The hourly MACD indicator for BNB shows increasing momentum in the bullish zone, while the RSI remains above the 50 level. These technical indicators provide additional context for traders analyzing the token’s short-term prospects.
On the support side, BNB has established multiple levels that could protect against downward movements. The first notable support sits at $675, followed by a stronger level at $668. Should these levels fail to hold, the next major support zone appears at $655.
Binance founder Changpeng Zhao, commonly known as CZ, has shared his perspective on BNB’s long-term potential. He noted that investors holding BNB for periods longer than four years have historically not experienced losses, though he cautioned that past performance doesn’t guarantee future results.
I do not know anyone who lost money on bitcoin (or BNB) by holding for 4+ years.
(not that this guarantees anything about the future.)
— CZ BNB (@cz_binance) January 22, 2025
The formation of a cup-and-handle pattern on BNB’s chart has caught the attention of technical analysts. This pattern, which began forming in 2021 and completed its handle formation in late 2024, suggests potential for upward movement with a technical target of $1,147.
Current market data shows BNB trading at $652.76, representing a modest 2% decline in recent trading. The price action continues to test the $661 support level, which previously acted as resistance.
The cryptocurrency’s price structure shows the completion of a 76.4% Fibonacci retracement level of the downward move from $691 to $637, indicating strong buying pressure during the recovery phase.
Trading volume patterns suggest active participation from market participants at current levels. The market continues to show interest in both support and resistance zones, creating clear price levels for traders to monitor.
Short-term price action indicates the formation of higher lows, typically considered a bullish market structure. This pattern aligns with the broader technical setup suggesting potential for continued upward movement.
For traders watching immediate price levels, the $685 zone remains crucial. A break above this level could trigger new buying interest, while failure to breach it might lead to a retest of lower support zones.
The most recent trading sessions have shown increased volatility near the $675 level, as bulls and bears contest this important price point. Market participants continue to monitor volume patterns for confirmation of price movements.
BNB’s recent price movements have occurred against the backdrop of broader market adjustments, with Bitcoin trading below $100,000 and other major cryptocurrencies showing similar patterns of volatility.
The post Binance Coin (BNB) Price: Recovers From $635 Support Level, What’s Next? appeared first on Blockonomi.