
TLDR
BNB is showing resilience at $625 support level despite recent correction
Price action forming a declining channel with resistance at $660
Technical indicators suggest potential for upward movement above $660
Multiple resistance levels identified at $650, $660, and $676
Strong support established at $625 with backup at $615
The price of BNB is showing resilience as it maintains support near the $625 level, following a period of downward correction from recent highs. After successfully breaching the $640 mark earlier, the cryptocurrency has entered a consolidation phase, with traders closely monitoring key technical levels.
The recent price action began after BNB reached the $685 resistance zone, where selling pressure emerged. Unlike its counterparts Bitcoin and Ethereum, BNB faced limitations in sustaining momentum above this level, leading to a measured decline.
Market data indicates that BNB experienced a descent below several important price points, including the $666 and $650 levels. However, buyers have maintained their presence above the crucial $625 support zone, preventing any further deterioration in price.
A local bottom formed at $626, marking a key level that bulls have defended. The price is currently holding above the 23.6% Fibonacci retracement level, calculated from the move between the $676 swing high and the $626 low, suggesting some stability in the current range.
Technical indicators reveal that BNB is trading below both the $650 price point and the 100-hourly simple moving average, typically considered a bearish signal in the short term. However, the formation of a declining channel on the hourly chart presents a clear structure for traders to monitor.
The immediate resistance level sits at $650, coinciding with the 50% Fibonacci retracement level of the recent downward movement. This price point represents the first major hurdle for any potential recovery attempt.
A key technical pattern has emerged in the form of a declining channel, with resistance established at $660. This formation is being closely watched by traders as a break above could trigger renewed buying interest.
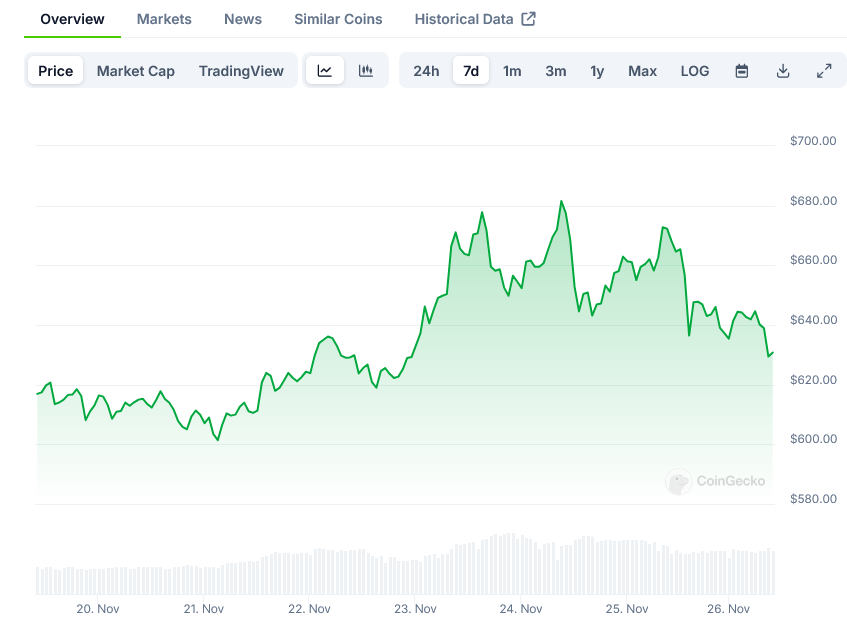
BNB Price on CoinGecko
Should BNB successfully break above the $660 resistance zone, the next target for bulls would be the $676 level. A decisive move above this point could open the path toward the previous resistance at $685.
The market structure suggests that if bullish momentum builds, the $700 level could come into focus as a potential target. However, this would require a sustained break above current resistance levels.
On the support side, several key levels have been established. The first notable support sits at $632, providing an initial buffer against further declines. Below this, the $625 level serves as a crucial support zone that bulls have defended successfully.
The technical indicators present a mixed picture. The hourly MACD shows declining momentum in the bearish zone, while the Relative Strength Index (RSI) remains below the 50 level, indicating neutral to slightly bearish short-term conditions.
If selling pressure increases and BNB fails to maintain the $625 support, the next major support level can be found at $615. This level represents a critical zone that could determine the medium-term direction of the asset.
A breach below $615 could potentially trigger a deeper correction, with the next support level positioned at $600. Further deterioration could extend the decline toward the $588 level, though current price action suggests limited likelihood of such a move.
The hourly chart reveals that buyers remain active near the support zones, with consistent demand emerging whenever the price approaches the lower boundaries of the current range.
Volume analysis indicates balanced trading activity, with neither buyers nor sellers showing overwhelming dominance in recent trading sessions. This equilibrium suggests a continuation of the consolidation phase until a clear breakout occurs.
The current price formation indicates that BNB is in a critical phase where the resolution of the declining channel pattern could determine the short-term trend. Traders are monitoring the $660 resistance level as a potential trigger point for increased buying activity.
The post Binance Coin (BNB) Price Analysis: Key Levels to Watch Above $660 appeared first on Blockonomi.