
TLDR
AVAX is currently trading at $36.72, showing a bearish trend with consistent rejections at the $40-$42 resistance level
Open Interest has declined alongside price drops, indicating reduced market participation and trader confidence
Strong support exists around $27, with VPVR data showing this as a key historical accumulation zone
RSI readings near 35 suggest approaching oversold conditions, though bearish momentum remains dominant
Short positions are increasing relative to longs, reflecting current market sentiment and adding downward pressure
Avalanche’s native token AVAX is experiencing increased selling pressure as technical indicators point to challenging market conditions. Currently trading at $36.72, AVAX/USDT has established a pattern of lower highs and lower lows, suggesting a continuation of the prevailing bearish trend.
Recent market data shows a clear resistance zone between $40 and $42, as highlighted by the Volume Profile Visible Range (VPVR). This area has proven to be a substantial barrier, with multiple failed attempts to break through during December’s rally. The repeated rejections at this level have reinforced the bearish sentiment among traders.
Trading volume analysis reveals a concentration of historical activity around the $27 mark, establishing it as a crucial support level. This zone represents a previous accumulation area where substantial buying interest emerged. Market participants are closely monitoring this level as a potential floor for the current price action.
The decline in Open Interest (OI) has emerged as a notable trend, coinciding with the recent price drops. This reduction suggests that traders are actively closing their positions, potentially indicating diminished confidence in AVAX’s short-term recovery prospects. The correlation between falling OI and price correction typically suggests that long position holders are exiting the market.
Technical analysis of the daily chart shows the Relative Strength Index (RSI) trading below the neutral 50-level, currently hovering near 35. This reading approaches the oversold threshold of 30, potentially indicating exhausted selling pressure. However, the consistent presence below 50 aligns with the overall bearish market structure.
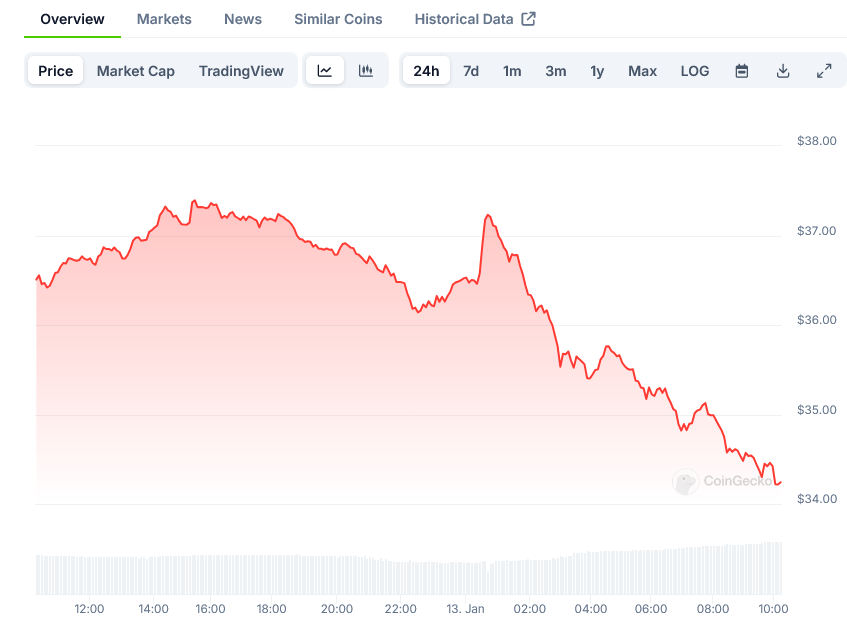
AVAX Price on CoinGecko
Market data indicates an increasing ratio of short positions compared to longs in the AVAX/USDT trading pair. This shift in positioning suggests that traders are preparing for potential further downside, particularly eyeing the crucial $27 support level as a possible target.
The VPVR indicator highlights the importance of the $40-$42 resistance zone, showing it as an area of intense historical trading activity. The failure to breach this level during recent attempts has contributed to the current bearish market structure.
Volume analysis shows declining participation during recent price movements, suggesting uncertainty among market participants. This reduction in trading activity often precedes continued downward pressure, particularly when combined with falling Open Interest.
The market structure currently displays a series of lower highs and lower lows, a classical bearish pattern that suggests continued selling pressure. This technical formation has remained intact since AVAX failed to maintain levels above $55 in November.
For any potential reversal, AVAX would need to show increased buying pressure accompanied by rising Open Interest. A successful break above the $40-$42 resistance zone, supported by growing volume, would be necessary to shift the current market bias.
Recent trading data shows that short-term bounces have been met with selling pressure, particularly near the $40 level. This behavior suggests that traders are using price increases as opportunities to establish new short positions.
The combination of technical indicators, including RSI readings and volume patterns, points to continued challenges for AVAX’s price action. The approach toward oversold conditions on the RSI might provide temporary relief, but the overall market structure remains bearish.
Trading volume patterns show decreasing participation during price bounces, suggesting limited buying conviction. This behavior typically precedes continued downward movement, particularly when combined with increasing short positions.
Current market data indicates that traders are closely monitoring the $27 support level as a potential target for ongoing price action. This area’s historical importance as an accumulation zone makes it a crucial level for market participants.
The most recent trading sessions show continued rejection at lower levels, with prices unable to sustain movements above short-term resistance points. This price action reinforces the current technical outlook suggesting further testing of support levels.
The post Avalanche (AVAX) Price: Trading Volume Patterns Suggest Key Support at $27 appeared first on Blockonomi.